To test their automated systems for possible bias across racial or gender lines, organizations may seek to know which individuals belong to each race and gender group. However, such information may not be easily accessible, and organizations may use techniques to infer such information in the absence of available data [1]. Here, we explore a dataset about mortgage applicants that we will use to test a methodology that relies on geographic information to infer race, similar to the Bayesian Improved Surname Geocoding (BISG) that we explored in our last post.
The Home Mortgage Disclosure Act
Under the Home Mortgage Disclosure Act (HMDA), mortgage lenders are required to collect data on the race and gender of mortgage applicants and report such data on an annual basis to the Consumer Financial Protection Bureau (CFPB), which publishes this data publicly. However, because the public data does not include applicant surnames, we cannot evaluate BISG directly using this data; rather, we will use a sample of the public HMDA data from 2017 to evaluate a geography-only-based approach to inferring race of mortgage applicants, following the procedures outlined by Chen et al. (2019) and the CFPB (2014) [2],[3].
For each mortgage applicant in the United States, the HMDA data includes self-reported race, ethnicity, gender, and other information, including geography information (census tract), applicant income, and information about the property. The mortgage data also includes the outcome of the application process (e.g., whether the application was approved or denied), but does not contain information on the outcome of the loan itself, like whether the applicant ultimately defaulted on the loan.
We selected a random sample of 300,000 mortgage applications from the 2017 data and then filtered out applicants who were missing either race and ethnicity information, valid geolocation information, or clear application outcome information, leaving a total of approximately 200,000 samples after filtering.
Racial Distribution of Applicants and Approval Rates
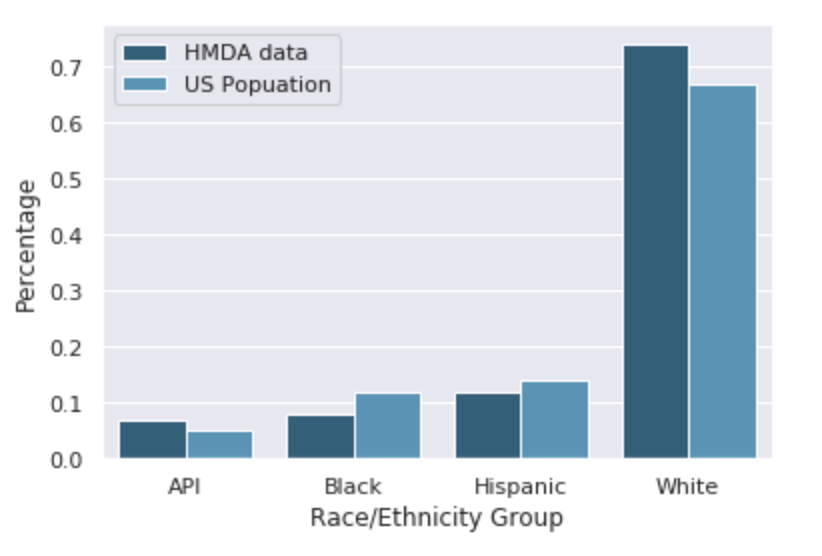
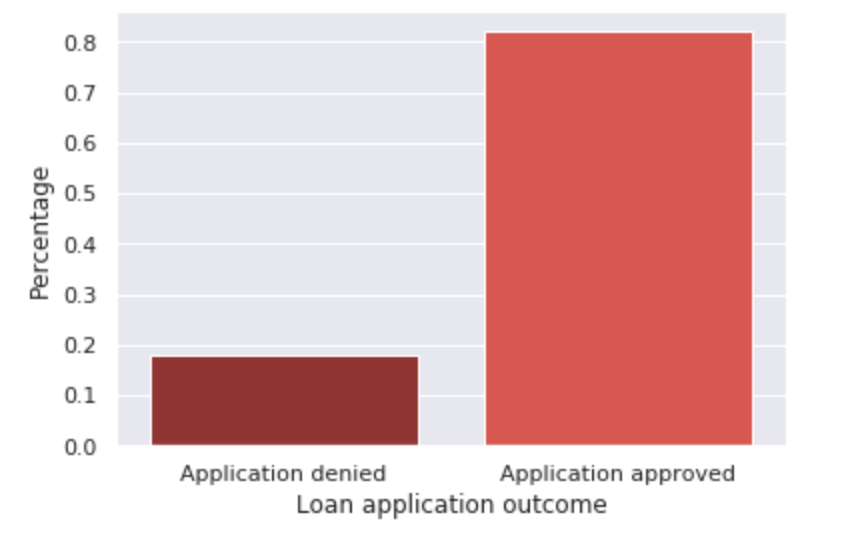
Figures 1 and 2 below highlight the racial distribution of our sample compared to the U.S. population and the frequency of each application outcome. We see that most applicants are approved for a loan, while about ⅕ of applicants have their application denied. Moreover, we see that the population of mortgage applicants here is somewhat different from the overall U.S. population in terms of racial distribution. Here, the population of mortgage applicants has a higher proportion of non-Hispanic White applicants and a lower proportion of Black and Hispanic applicants than does the U.S. population, important background to keep in mind for our analysis.
We can also look at the rates of application approval across race groups (Figures 3 and 4) to see that the percentage of Hispanic/Latino and Black/African American applicants who are approved is lower than the percentage of White and Asian/Pacific Islander applicants who are approved. While not necessarily indicative of bias in the decision-making process, these disparities in approval rates are important to note and raise the natural question of why approval rates are not equal across groups. For example, is there some other information in the dataset that could help explain the disparities? While we will not explore this question in depth here, it indicates an important area of further analysis to understand possible bias. Instead, we will focus on what we might guess the disparities in approval rates would be if we did not know what race each applicant was and instead had to infer it. Would we see the same level of disparity, indicating that we should dig deeper into the mortgage data to try to understand it, or would such disparities disappear?
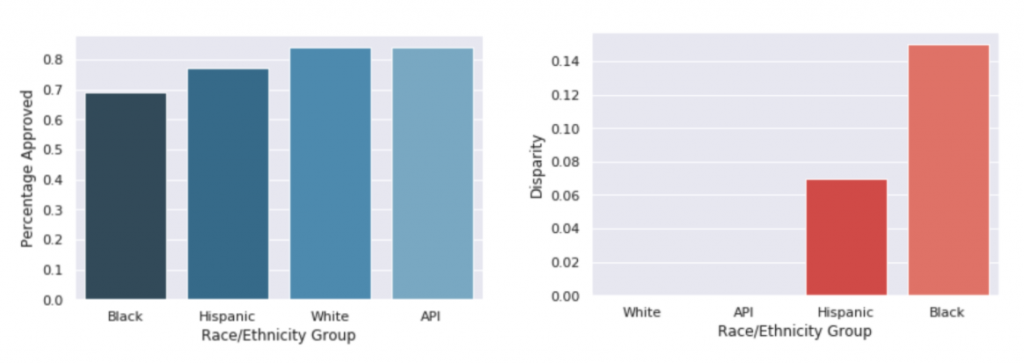
In our next post, we will simulate the situation of an organization that wants to explore possible bias in their decision-making process but lacks ground truth labels about the race of applicants that we utilized here. To do so, we will pretend as if we do not actually have access to the self-reported race/ethnicity of each applicant and test how well inferring race using an applicant’s location information does at approximating the approval rates and disparities in approval rates that we see in Figures 3 and 4.
References:
[1]: Bogen, M., Rieke, A., & Ahmed, S. (2020, January). Awareness in practice: tensions in access to sensitive attribute data for antidiscrimination. In Proceedings of the 2020 Conference on Fairness, Accountability, and Transparency (pp. 492-500).
[2]: Chen, J., Kallus, N., Mao, X., Svacha, G., & Udell, M. (2019, January). Fairness under unawareness: Assessing disparity when protected class is unobserved. In Proceedings of the Conference on Fairness, Accountability, and Transparency (pp. 339-348).
[3]: Bureau, C. F. P. (2014). Using publicly available information to proxy for unidentified race and ethnicity: A methodology and assessment. Washington, DC: CFPB, Summer.
