AI adoption is rapidly rising across industries. With the advent of Covid-19, digital adoption by consumers and businesses has vaulted five years forward in a matter of eight weeks. However, the complexity of deploying ML has hindered the success of AI systems. MLOps and specifically the productionizing of ML models come with challenges similar to those that plagued software prior to the arrival of DevOps Monitoring.
Detecting model drift is just one element of MLOps Monitoring - This post, How to Detect Model Drift in ML Monitoring, is part 1 in a series that will cover key components to success. If you’d like to receive future posts or our forthcoming whitepaper on the rise of MLOps Monitoring, click here.
Operational Challenges in ML
Unlike traditional code, ML models are unique software entities, whose performance can fluctuate over time due to changes in the data input into the model after deployment. Consequently, successful AI deployments require continuous ML Monitoring to revalidate their business value on an ongoing basis.
ML teams can use model performance metrics like AUC, precision, recall, etc. to monitor the real-time performance of production models. However, these metrics need ‘ground truth’ or labels for these real-time predictions. While labels are always available in a training data set, they might not always be available in production for a given use case. For example, when a model makes a prediction for loan risk, the lender will only know if the loan defaulted or was paid in full over the lifetime of the loan. In the absence of these inputs or to complement the visibility of these performance metrics, monitoring changes in production features and prediction distributions can be used as a leading indicator and troubleshooting tool for performance issues.

What is drift?
Drift is the change in an entity with respect to a baseline. Data drift, that underlies model drift, is defined as a change in the distribution of data. In the case of production ML models, this is the change between the real-time production data and a baseline data set, likely the training set, that is representative of the task the model is intended to perform. Production data can diverge or drift from the baseline data over time due to changes in the real world. Drift of the predicted values is a good proxy for concept drift, or data integrity issues and can inform model re-train cadence
Types of ML drift
There can be four types of drift depending on the data distribution being compared:
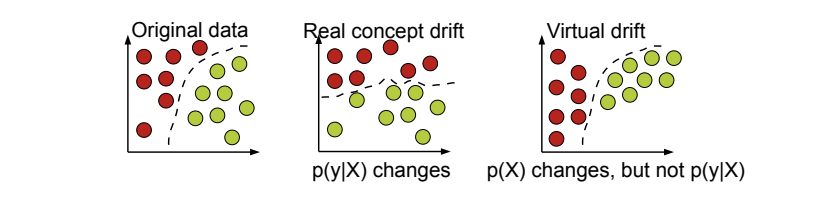
- Concept drift or change in P(Y|X) is a shift in the actual relationship between the model inputs and the output. An example of concept drift is when macroeconomic factors make lending riskier, and there is a higher standard to be eligible for a loan. In this case, an income level that was earlier considered creditworthy is no longer creditworthy.
- Prediction drift or change in P(Y hat Prediction|X) is a shift in the model’s predictions. For example, a larger proportion of credit-worthy applications when your product was launched in a more affluent area. Your model still holds, but your business may be unprepared for this scenario.
- Label drift or change in P(Y Ground Truth) is a shift in the model’s output or label distribution.
- Feature drift or change in P(X) is a shift in the model’s input data distribution. For example, incomes of all applicants increase by 5%, but the economic fundamentals are the same.
Concept drift is essentially a discrepancy between a real and learned decision boundary. It necessitates re-learning the data to maintain the error-rate and accuracy of the previous regime. If ground truth labels are available and sufficiently real-time, performance drift is the strongest indicator of this. In the absence of real-time ground truth, drift in prediction and feature distributions are often indicative of important changes in the world. Unlike performance-drift, however, it is possible for these quantities to drift with respect to an accurately modeled decision boundary (“virtual drift” below). In that case, model performance will be unchanged.
Reference: A Survey on Concept Drift Adaptation - Joao Gama et al
Causes of drift
There are several reasons for drift to occur in production models:
- When there is a real change in the data distribution due to externalities. This may require a new model with an updated representative training set.
- A change in ground truth or input data distribution e.g. shifting customer preferences due to a pandemic, product launch in a new market etc.
- There is a concept change. e.g. a competitor launching a new service.
- When there are data integrity issues. This requires further human investigation.
- Correct data enters at source but is incorrectly modified due to faulty data engineering. For example, debt-to-income values and age values are swapped in the model input.
- Incorrect data enters at source. For example, due to a front-end issue, a website form accepts leaving a field blank.
How to calculate data drift
There are two techniques to measure drift:
Statistical: This approach uses statistical metrics. A key advantage to this approach is user comprehension of these metrics given that are already being used in several industries, especially finance and banking. They also have the added benefit of being simpler to implement.
- Population Stability Index, popular in financial services, is a measure of population stability between two population samples.

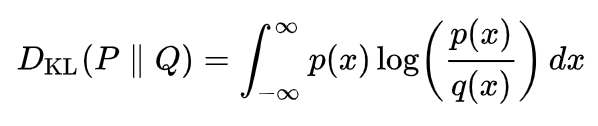
Kullback–Leibler (or KL) divergence is a measure of how one probability distribution is different from a second, reference probability distribution.
Jensen-Shannon (or JS) divergence is a method of measuring the similarity between two probability distributions. It is based on the KL divergence, with some notable differences, including that it is symmetric and it always has a finite value.

Kolmogorov-Smirnov test (or KS test) is a nonparametric test of the equality of continuous (or discontinuous), one-dimensional probability distributions that can be used to compare a sample with a reference probability distribution (one-sample K–S test), or to compare two samples (two-sample K–S test).

Model-based: This approach uses a model to determine the similarity between a given point or groups of points to a reference baseline. While using ML based techniques can give a more accurate picture of drift, explaining the basis of the technique can be a challenge for forming an intuit.
How to identify causes of drift
Monitoring prediction and feature drift without the right tools can be tedious. A data scientist or ML engineer accountable for maintaining production models has to continuously compare a selected window of live traffic with a baseline using one of the techniques above.
When drift in model output is captured, the next step is identifying which features caused the drift. Many times an input feature might have drifted a lot but it might not have caused a meaningful drift in the model output (i.e. spurious drift) because the feature has low importance in the model. Identifying the source of the drift involves assessing the underlying drift in features relative to their input importance.
At Fiddler, we use JS-Divergence and Explainable AI to help identify and troubleshoot both prediction and feature drift in a few steps:
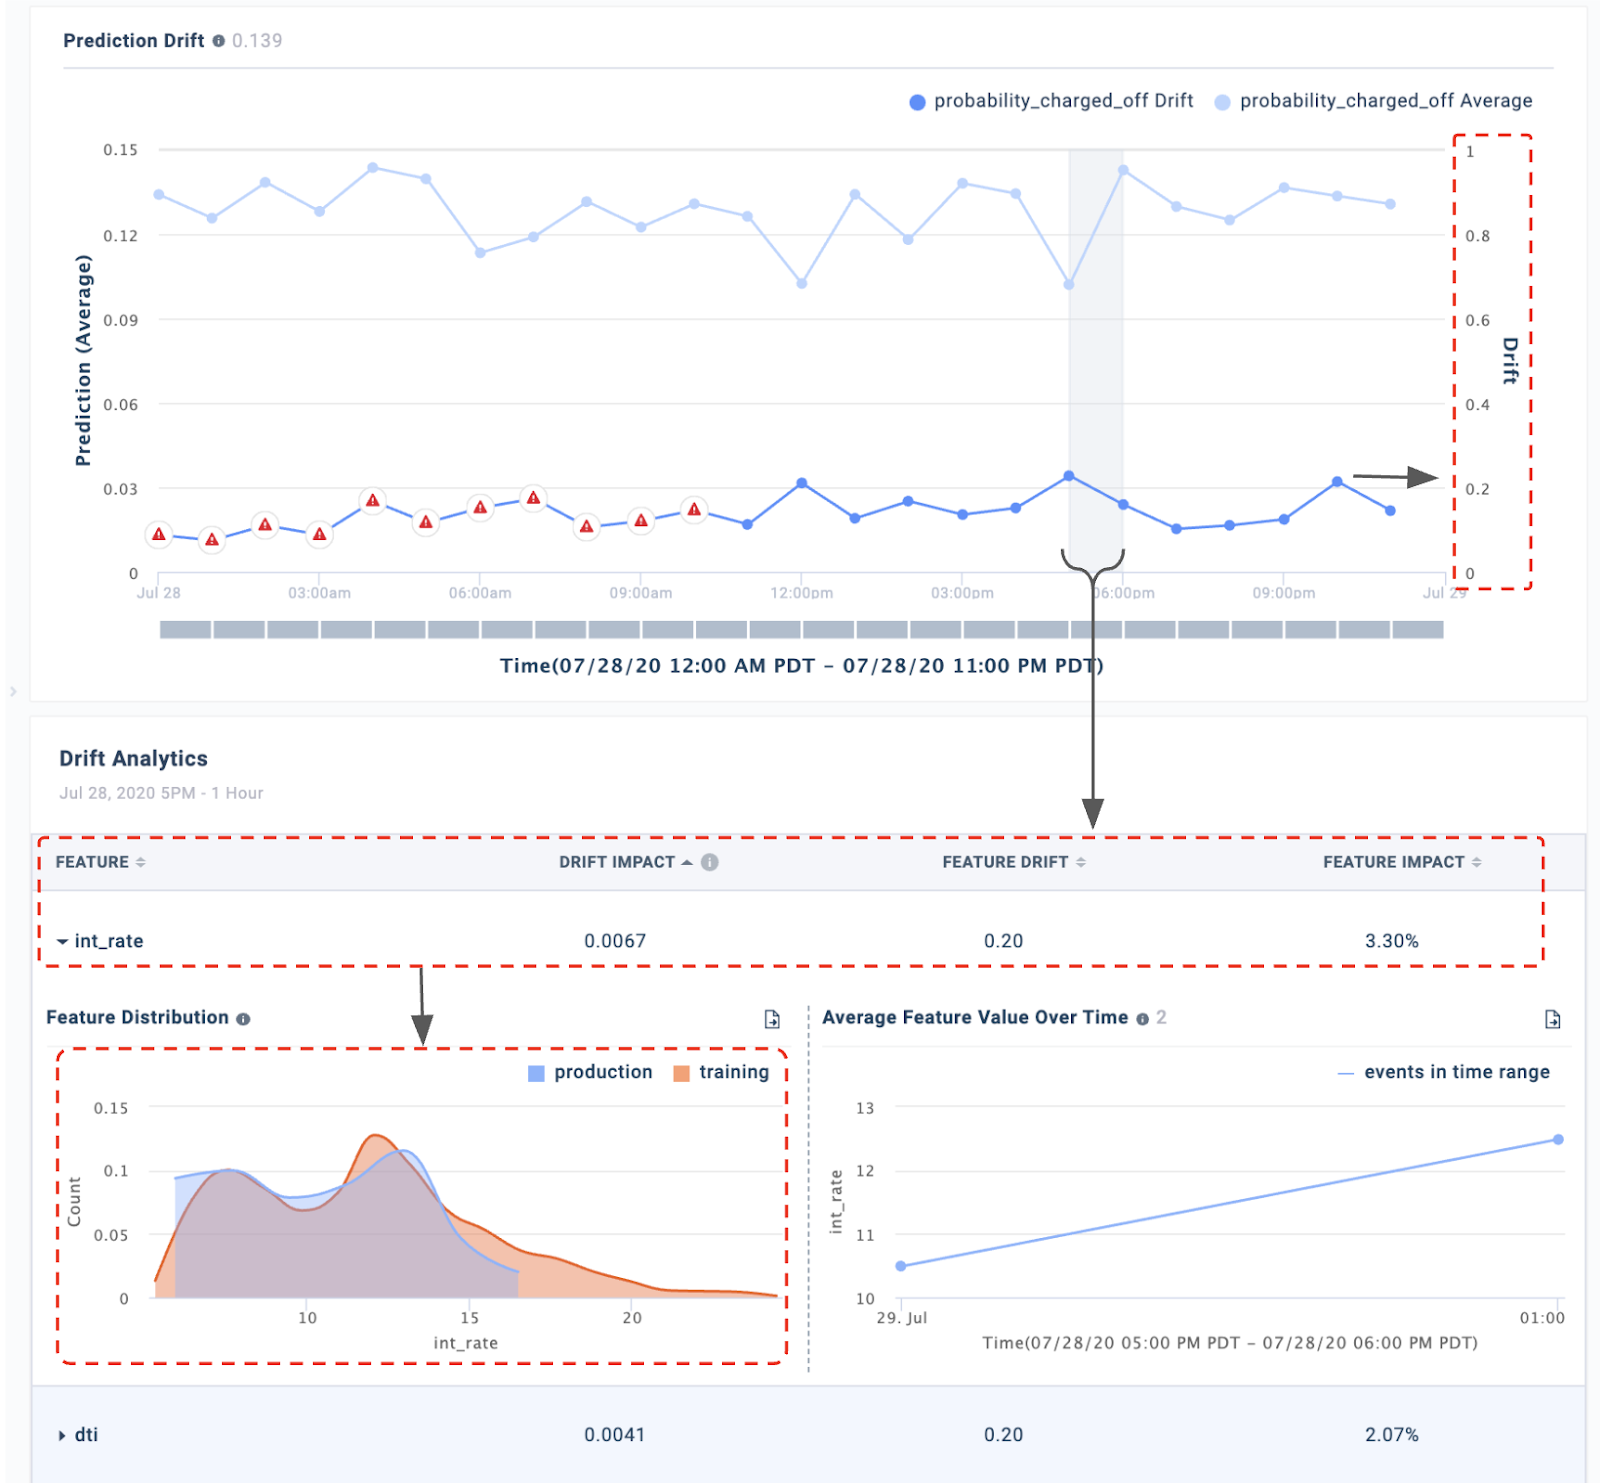
Step 1: Quickly identify prediction drift in real-time model outputs as compared to a training or baseline set complimenting JS-Divergence with your domain knowledge on drift thresholds on production data.
Step 2: Drill down into the selected time window to view drift in underlying features, again using JS-Divergence. Use explainability to view feature importance of the drifted features and focus only on the ones that have a meaningful impact, filtering out spurious drift.
Step 3: Compare data distribution to view the actual difference and form an intuition around the need for model retraining.
Step 4: Analyze affected traffic slice further for performance insights into the drift.
In summary, data drift monitoring in ML models helps ML teams stay ahead of performance issues in production and Explainable AI complements it by providing powerful diagnostic tools a click away from any suspicious time-slice.
